
When profiling your game, you will generally be focused on two issues; eliminating performance spikes and decreasing the time it takes for SAM to load/unload Asset Chunks.
This guide is generally focused on the former issue, although there is some information on the latter as well.
The markers we will be highlighting will always show up in either the Scripts or Others category, so disabling the other Categories can be helpful in observing frame spikes/issues.
Thread switching occurs when two threads (usually the Main Thread and Background/Preloading Thread) need to access the same resources at the same time. Whichever thread gains access to resources first will lock them, and the other thread will have to wait until the resources are unlocked.
Thread switching is problematic when the Main Thread is left waiting on another. It will typically result in frame spikes and can cause a frame's timing to go over whatever you've allotted for it. Even if your frame timings are still currently okay despite the thread switching, it's still an issue that indicates inefficiency and leaves you less room to add other systems that may take up valuable CPU time in the future.
With that said, in some cases the thread switching may not be problematic and attempting to eliminate it may cause the speed of SAM's World Update Cycle to be slower. Thus, you'll need to evaluate each thread switching case independently to determine whether it's worth fixing!
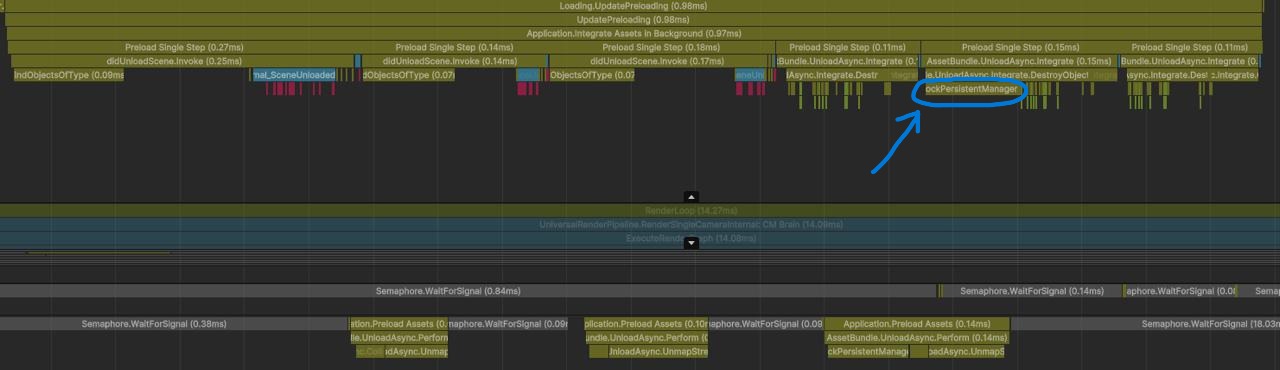
Thread switching can present itself either via the WaitForSignal or LockPersistentManager (the latter is more common on the Main Thread). Many SAM and Unity operations are vulnerable to thread switching, so let's go over them one by one.
1) Too Many Queued Async Load Calls
If an issue, you'll generally find the thread switching markers under the SAM.InitiateAsyncLoadOfAssetChunkToo or AssetBundle.LoadAssetBundle markers.
Resolution
Navigate to your Chunk Streamer and reduce the value of Default Max Async Load Ops To Start In A Single Frame. We suggest using a value of 2 (3 max), as Unity seems to have trouble with anything greater (unless you are on a more recent version where this issue has been fixed). If reducing this value does not solve the problem, you can try changing Default Max Concurrent Async Operations to be equal to whatever value you set for Max Async Load Ops To Start, however note that usually, controlling the value of Max Async Load Ops To Start is enough (meaning you can leave Max Concurrent Async Ops set to 0 which means unlimited).
2) Asset Chunks Are Too Large (Loading)
If an issue, you'll generally find the thread switching markers under the Application.Integrate Assets In Background marker, although in some cases you'll find them under the markers mentioned in Issue 1 above.
Resolution
Thread Switching in this situation generally occurs because some background loading operation was not able to finish during the previous frame, which indicates that your Asset Chunks may be too large. If this is the case, you'll notice an operation on the Preload Manager running over from the previous frame into the current one.
If using Multi-Chunking, you can lower the Children Per Chunks value and try re-evaluating your Chunks using the World Designer Tool (E* button).
If your Chunks contain just a single asset like a Terrain, you'll have to slice or reduce the asset size somehow.

3) Too Many Queued Async Unload Calls or Too Large Asset Chunks
You'll generally find the thread switching markers under the AssetBundle.UnloadAsync.Integrate marker.
Resolution
This issue should only be addressed if the thread switching is taking up a large portion of time. In these cases, you have three options:
1) Reduce the value of Default Max Async Unload Ops To Start In A Single Frame on your Chunk Streamer.
2) Use a Chunk Destroyer to destroy your Chunks manually, which if using scenes will result in the scenes being very lightweight for unloading.
3) Reduce the size of your chunks as discussed in the Resolution above.
Activating and Deactivating Asset Chunks is not without peril! If your asset chunks are too large, attempting to activate or deactivate just a single Asset Chunk can be problematic.
Activation/Deactivation issues should present themselves under the SAM.ActivateAssetChunk/SAM.DeactivateAssetChunk markers respectively, although you will need click on the GameObject.Activate/GameObject.Deactivate markers to identify the asset chunk(s) which are causing the problem. Also note that in some cases, the GameObject.Deactivate calls may be very small and appear unconnected to SAM.DeactivateAssetChunk.
Resolution
If only a few Asset Chunks are causing a problem, reducing their size (if possible) can be one solution. Another and often time better solution is to adjust the Activation/Deactivation related settings on the World.
If your Max Chunk Activations/Deactivations Per Frame value is very high, reducing it can be a great first step. Another possibility (available only if your Asset Chunks are made up of many children) is to enable the Activate/Deactivate Chunk Children option and tune Max Child Activations/Deactivations Per Frame setting. With these settings enabled, SAM will forego activating/deactivating the Asset Chunks in one single operation and instead spread the operation out by activating/deactivating X children per frame.
Also remember that the Activation/Deactivation settings can be overridden for particular Groupings or even particular LOD Groups on specific Groupings. This can be useful for targeting certain Asset Chunks rather than all Asset Chunks
Be Careful
Reducing the number of activations/deactivations unnecessarily can reduce the speed of the world's update cycle, which means streaming will be slower. If you don't notice any issues with activating/deactivation, you may benefit from increasing the number of activations/deactivations!
Using Prefabs incurs an additional performance hit in the form of Prefab Instantiation. If your Asset Chunks are too large/heavy, you'll notice these problems under the SAM.ConfigureAssetChunk marker.
Resolution
You can reduce the size of your chunks, or try reducing the number of chunks which are instantiated in a single frame, by reducing the value of Default Max Chunks To Configure In A Single Frame on your Prefab based Chunk Streamer. Which option you choose will depend on the used CPU time of a single SAM.ConfigureAssetChunk operation. If the time is very large, reducing the chunk size will be the only option, however if the time is small but it is simply that too many of these calls are appearing on a single frame, adjusting the Max Chunks To Configure setting should help.
Did You Know?
While SAM has a mechanism for limiting how much time operations take up in a single frame (via Execution Controllers, some operations such as instantiation are not executed until the following frame. These operations' timings cannot be predicted and thus cannot be controlled by Execution Controllers.
If using a Prefab based Chunk Streamer without a Chunk Destroyer, or if using any Chunk Destroyer with one, you may run into issues trying to destroy your Asset Chunks! These issues can be found under the SAM.DestroyAssetChunk marker, although if using a Chunk Destroyer you may find these under GameObject/Object.Destroy markers (usually there will be multiple in a short amount of frame time) that is unconnected to the SAM.DestroyAssetChunk marker.
Resolution
The first line of defense for this issue is using a Chunk Destroyers, however if you are already using one, you can try reducing the Default Target Objects To Destroy In A Single Frame value, or enabling the Count Grandchildren option.
If your Asset Chunks do not have children and using a value of 1 for Default Target Objects To Destroy In A Single Frame does not rectify the issue, you will need to reduce your Asset Chunk sizes somehow!
The limiting factor to the World's update cycle speed is typically the time it takes for Unity to asynchronously load and unload your Asset Chunks. Fortunately, Unity has a dedicated thread to perform these operations known as the Preload Manager.
In order to make loading/unloading as efficient as possible, it's necessary to maximize the use of this thread! Ideally we would do this by queuing up a high number of async loads at once, however this results in thread switching problems, and you can usually only queue up 2 async loading calls at once.
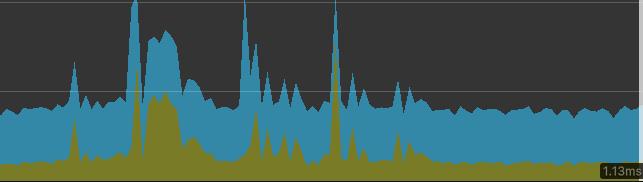
Thus, in order to maximize the amount of time used by the Preload Manager, you need to make sure your Asset Chunks are sufficiently large. To identify whether this optimization is possible, observe the Preload Manager using the Profiler.

If the async loading ops are not utilizing the full Preload Manager frame time, then you can probably increase the size of your Asset Chunks! Do note that other operations like Instantiation or Activation of the Asset Chunks should also be factored in; if these are already taking up significant time than increasing the size of your Chunks will only make the problem worse.
Initialization will almost always take longer than normal update cycles, since you're generally asking SAM to load a greater quantity of Cells/Asset Chunks when the game starts.
If you don't mind your game or loading screen appearing to "freeze", using Two Frame Initialization will usually be faster (in terms of how long the initialization takes in raw time) but will not generally be pleasant to the user's experience.
With Gradual Initialization, you can display a loading screen with a smooth progress bar, however other than modifying the Application.backgroundLoadingPriority to making loading faster (which may not always have a big effect depending on your Asset Chunks), the mechanisms for loading the game World during gradual initialization are the same as used for the normal World Update Cycle. This means things like World Grouping Listeners and Cell Visual Transition Controllers will still be executing in gradual mode, and Execution Controllers will be respected.
With that said, although Gradual Initialization can take longer than Two Frame Initialization, the time is usually not so great as to present a problem. If your game is taking a really long time to load (i.e., multiple minutes) then it is likely not a SAM issue (unless you are loading 100's or 1000's of Asset Chunks).
In these cases, profiling a game build is your best option to diagnose the problem. If you notice one or a few really big frame spikes over a few frames, the issue is likely related to some resource being loaded for the first time. Examine the frame spike to find out what resource is causing the issue.
One of the most common problems we've run up against is Shader Loading, which is when Unity loads shader variants on the GPU. Unfortunately this is a very slow process, especially for larger shaders with many variants. You can identify these issues by the Shader.ParseThreaded or Shader.ParseMainThread markers.
If this is a problem for your game, you can create a Shader Variant Collection and use it to pre-warm the shaders once at the launch of your game (many games employ this strategy). Then when you actually start your game world and SAM loads, it should load much faster.
Which mechanism you use to pre-warm the shaders will depend on how you are loading your Asset Chunks. If using the Addressable System, you should mark the Collection as addressable, load it using Addressables.LoadAssetAsync, then pre-warm the shaders using ShaderVariantCollection.WarmUp or ShaderVariantCollection.WarmUpProgressively (https://docs.unity3d.com/ScriptReference/ShaderVariantCollection.html).
If not using Addressables, you can add the Collection to the Preloaded Shaders list found in Project Settings/Graphics.
More info on shader loading can be found at (https://docs.unity3d.com/6000.1/Documentation/Manual/shader-loading.html)
In the Initialization sub-section above, we discussed the possibility of using shader pre-warming to pre-load shader variants on the GPU in order to get some of the costs of initialization out of the way at the launch of the game, rather than paying the cost each time a SAM scene is loaded.
This strategy can also be employed if shader loading is causing performance issues during the normal World Update Cycle. Do note, however, that shaders may be unloaded throughout the course of your game as the asset chunks using them are unloaded (by default, when no assets using the shader are loaded, the shader will be unloaded). If those assets are then needed at a later time, the shaders will be needed again and will need to be re-loaded.
You can avoid this issue by enabling the Keep Loaded Shaders Alive setting in Project Settings/Player.
Unfortunately, doing this will remove some of the memory savings SAM helps achieve, since the shader variants will be loaded for the entire life cycle of your game. In these cases, if the shader memory use is very high, you will need to try and reduce the number of variants in your game, which is a tricky and complicated subject.
Also note that if using the Addressable system, any shaders included in Asset Bundles and used by your Addressable Assets will be completely separate entities in relation to shaders included with your game build. This can result in the same shader being duplicated multiple times. To avoid this, follow these rules:
1) Always make your shaders into Addressable assets themselves. This will ensure that they are not pulled in automatically by assets/materials, which may result in the shaders being duplicated across multiple Asset Bundles.
2) If a shader is needed by Addressable Assets, try to make sure it's not used by other assets that aren't addressable. This includes assets found in scenes or in the Resources folder. To the best of your ability, try to make these assets Addressable and then load them when needed using Addressables.LoadAsset(s)Async.